Note
Click here to download the full example code
visibility_rainbow1
style = “visibility_rainbow1”
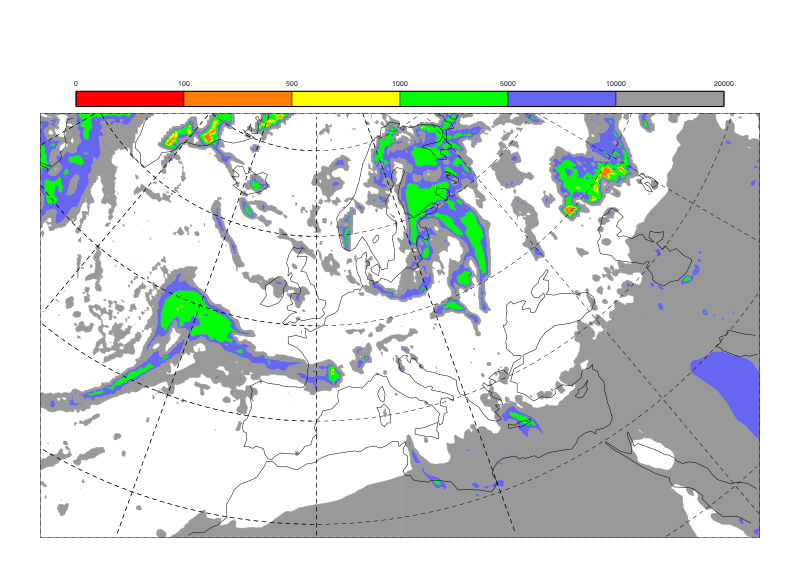
magpye has a list of predefined styles, that can be used to visualise your data.
More options are available to customise your visualisation.
The data for this example can be downloaded from one of our repositories: https://get.ecmwf.int/repository/magpye/data/vis.grib
from magpye import GeoMap

map = GeoMap(area_name="europe")

map.contour_shaded("vis.grib", style="visibility_rainbow1")
map.gridlines(line_style="dash", labels=False)
map.coastlines()
map.legend()
map.save("visibility_rainbow1.png")

# sphinx_gallery_thumbnail_path = '_static/styles/visibility_rainbow1.png'
Total running time of the script: ( 0 minutes 0.000 seconds)